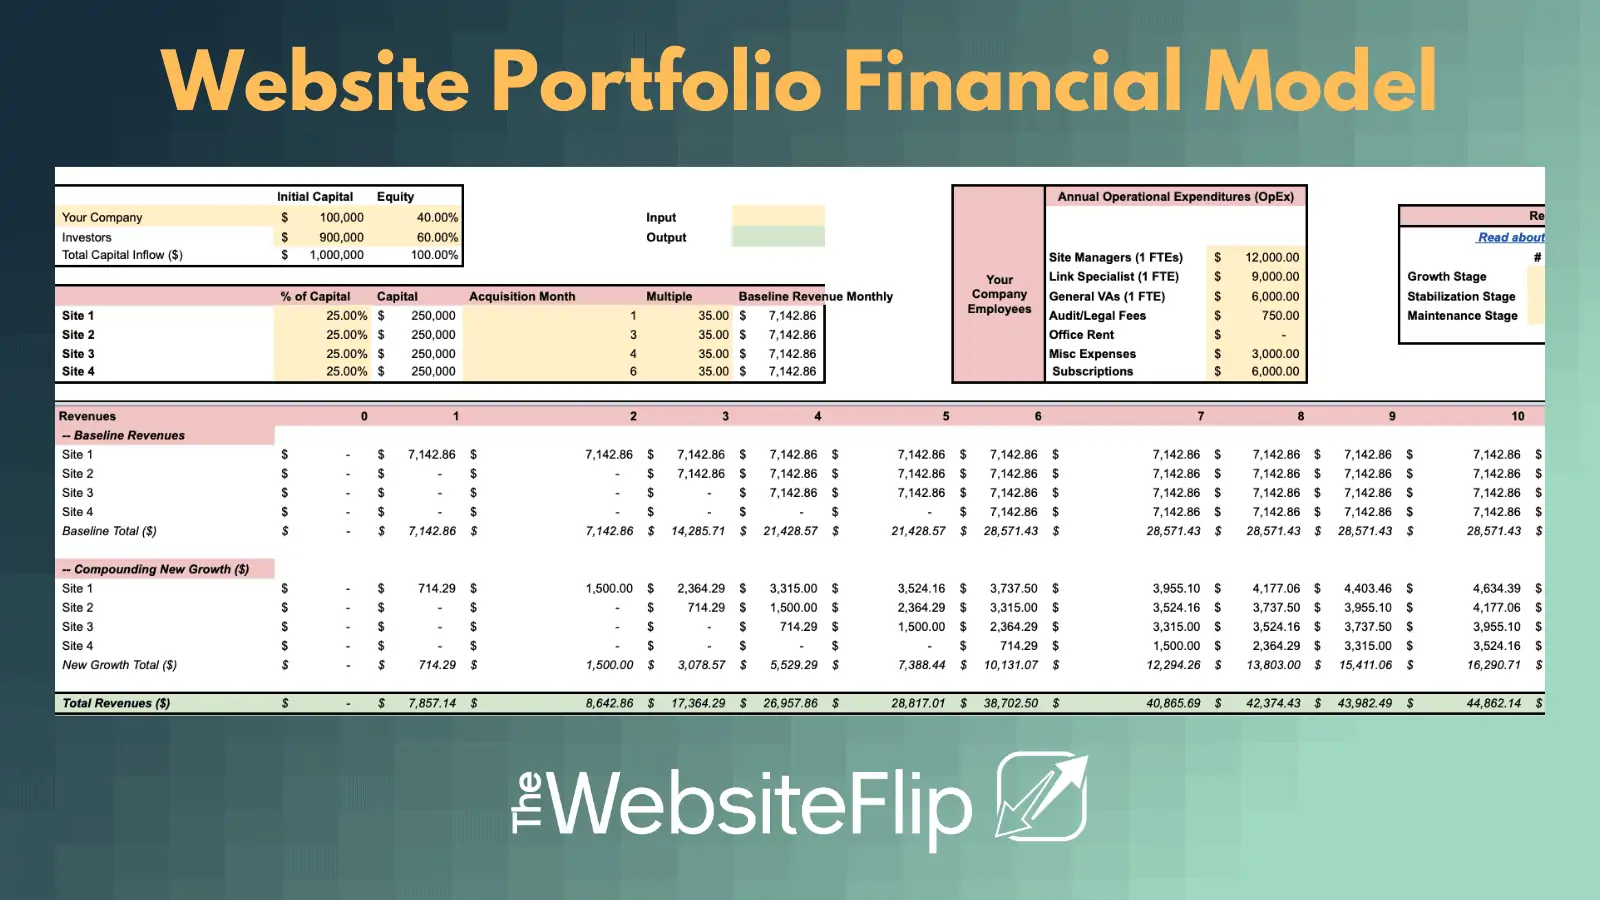
Have you wondered what are the returns of a portfolio of content website acquisitions across a multi-year horizon? Or, what is the yearly returns if investors are involved?
I am open sourcing my portfolio financial model in Google Sheets. The base model does the financials for 4 website acquisitions totaling $1M with third-party investors. This is useful if you are planning to raise money for your media business.
This model was used by an operator to help secure their position within EF Capital’s first round. The model encompasses my battle-tested strategy of the 5-stage lifecycle of a website flip, operational (OpEx) and capital expenditures (CapEx), and much more.
In this write-up, I will cover the following:
- How to download
- Explanation of model inputs
- Explanation of model outputs
- Possible scenarios
Before we get into the explanations, make sure to follow along by getting your copy of the Google Sheet below.
Download: Content Site Portfolio Model
To make a copy of the Google Sheet, click the button below:
Once you click the link, do the following:
- You will get a page where you can copy the Google Sheet. Click it.
- Your Google account will receive a fresh copy of the model
- This is your personal copy that you can manipulate
Note that all customizable inputs have a light yellow background. All outputs of the model have a light green background. See color schemes below:
You can tweak the inputs to your needs.
Major assumptions to note
- Models a 3-year horizon (36 months) of operations
- After 3 years, all of the sites are sold through a broker
- Pre-set numbers assume constant growth. You can change that to assume growth slows down by changing the input numbers
👉 Explanation of Model Inputs: 7 Major Inputs
There are several inputs in the model that can be fine-tuned to your needs and situations. They are categorized as follows:
1. Initial Capital and Equity Splits
The model is able to handle two parties: your company and investors. Each party allocates capital for acquisitions and in return receives equity.
You can customize how much capital each party invests in relation to their equity. For example, investors can invest $500,000 into a $1M fund but receive 30%.
2. Website acquisitions

Another set of inputs is the website acquisition metrics. You can customize how much of the capital is allocated to each deal by percentages, which month in the 3-year lifecycle they are acquired, and at what multiple.
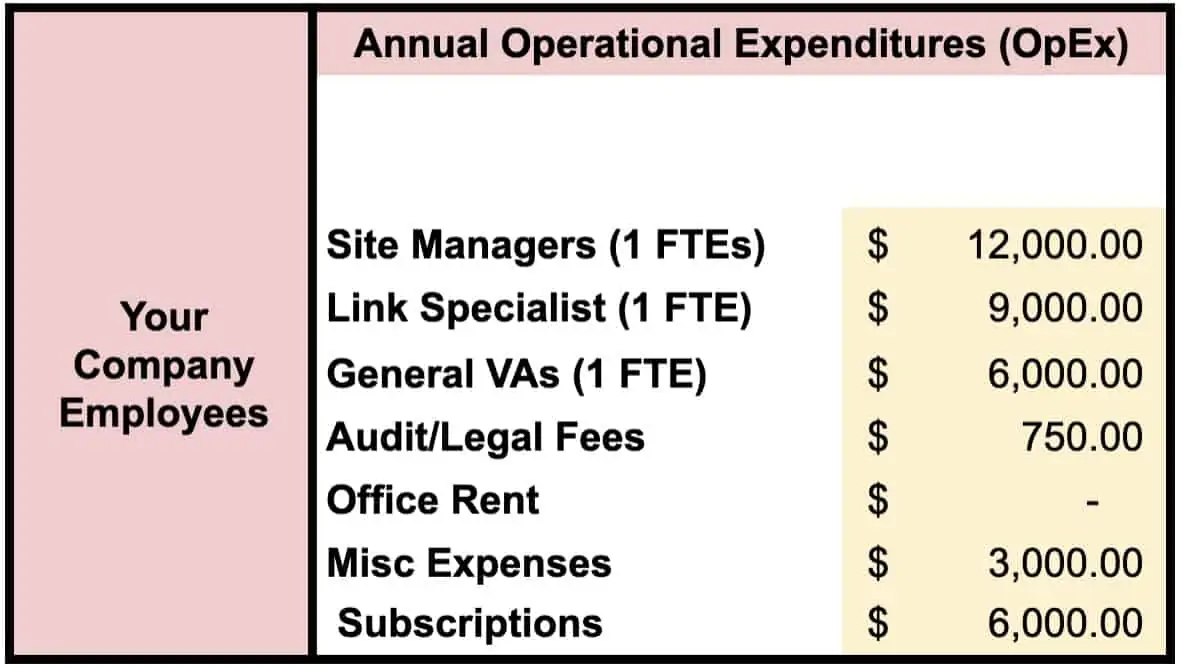
3. Annual operational expenditures (OpEx)
Content website operations has expenses. This includes the operation manpower, subscriptions, legal fees, etc.
The customizable options are as follows:
For employees/VAs, the hierarchy assumed the following:
- Site Managers: this person’s responsibility is to act as the website operator and manage the overall day-to-day of the sites. This person’s high-level tasks are to ensure the growth strategy laid out by you, as the owner of the fund, gets executed. A top-notch manager can manage 4-5 sites full-time.
- Link Specialist: This individual is constantly doing outreach to build backlinks and partnerships for the portfolio
- General VAs: these can be full-time or by the hour VAs that do tasks like content formatting, social media posting, and other tasks based on standard operating procedures (SOPs)
All employee-related costs are in terms of FTEs or known as Full-Time Equivalents. This is essentially the cost of hiring a full-time person on staff.
4. Revenue growth
The model assumes a baseline revenue (i.e., the revenue acquired as-is when buying the website), and then also revenue growth after the acquisition.
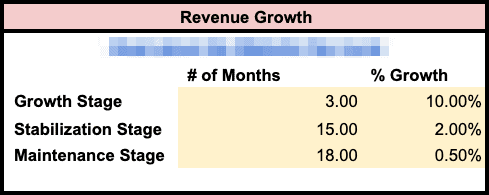
The revenue growth model is split into three stages: (1) growth, (2) stabilization, and (3) maintenance stages. This is part of my website flip cycle framework. The model has pre-built numbers based on my operational model.
The order is Growth, then Stabilization, then Maintenance in that order across a 36 month horizon (3-years).
Here are the assumptions:
- Growth: first 3-month growth plan with a 10% compounding month-over-month (MoM) revenue growth
- Stabilization: next 15-month period with a 2% compounding MoM growth
- Maintenance: next 18-month period with a 0.5% compounding MoM growth
5. Content reinvestments
Of the revenues being generated, a certain amount is reinvested into content, which is a major growth lever. Content is assumed to be outsourced to agencies, or direct hires as freelancers for each individual site; there is no in-house team of writers.
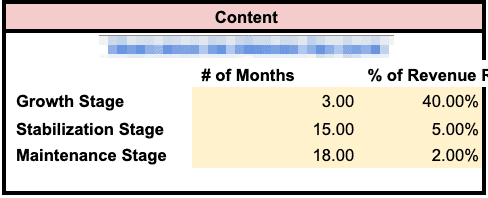
Base on the three-step lifecycle of Growth, Stabilization, and Maintenance, the revenues are put back accordingly. In the growth stage, 40% of revenues each month are assumed to be put back into the site over a 3-month period.
For example, if revenues are $10,000/mo, then we are putting in $4,000 each month for 3-months equating to $12,000 total.
Graphically, this is what the content reinvestment (cost) timeline looks like for an example site:

6. Backlink reinvestments
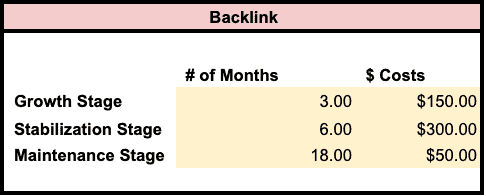
Backlinks are modeled as monthly fixed costs as opposed to a percentage of revenues like content is.
This is because the model assumes a link specialist is hired in-house and is already on the payroll. The link costs include what we payout to website owners if they have an admin fee for a guest post or niche edit. It is assumed per link admin cost is around $30-$50 per link.
The assumption is that one invests more back into backlinks in the stabilization stage once the bulk of new content is published. This then allows the team to understand which articles need backlinks to get them ranking better.
7. Future sale multiple
The final input is the future sale multiple. I assume the sale multiple at the end of year 3 will be higher than it is starting today; therefore, it is assumed to be 42 times the monthly average revenues.
This is in line with actual multiples various website brokers are listing sites for today. For example, Empire Flippers’ content sites are being listed north of 40x as of Q1 2021 already.
👉 Explanation of Model Outputs: 6 Outputs
After the inputs are set, the model will output the following:
1. Revenues for baseline vs new growth
The monthly revenues are split between baseline vs new growth. When a site is acquired, the L6M becomes the baseline revenues. Anything above the L6M baseline is coined as new growth. This can be graphically seen as follows:
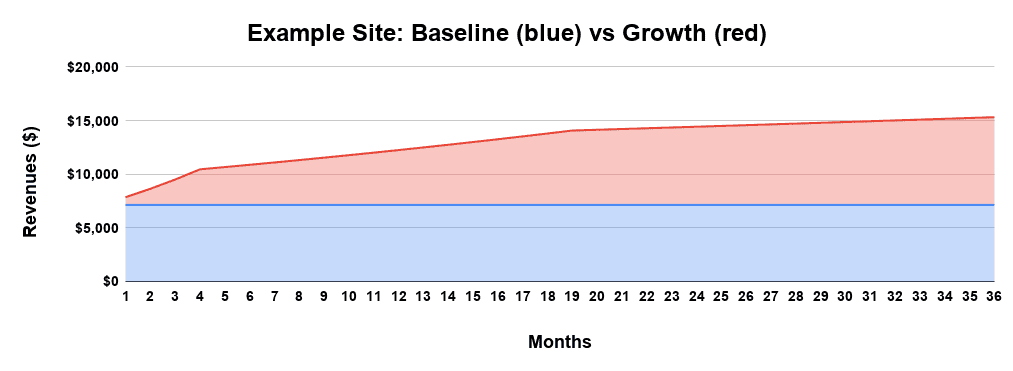
This allows you to see new growth based on your inputs (red) vs what has been done by the previous owner (blue) as the baseline.
2. Team and Website OpEx Costs
A month-by-month breakdown of the team and website costs are provided. This allows you to get even more granular if you would like to calculate metrics like:
- Return on investment of each employee
- The unit economics of revenue vs costs per source
3. Profit share by month (i.e., dividend payouts)
If you want to understand payouts to each party (i.e., yourself and/or investors), the cashflows are calculated on monthly basis. This can be visualized as follows:
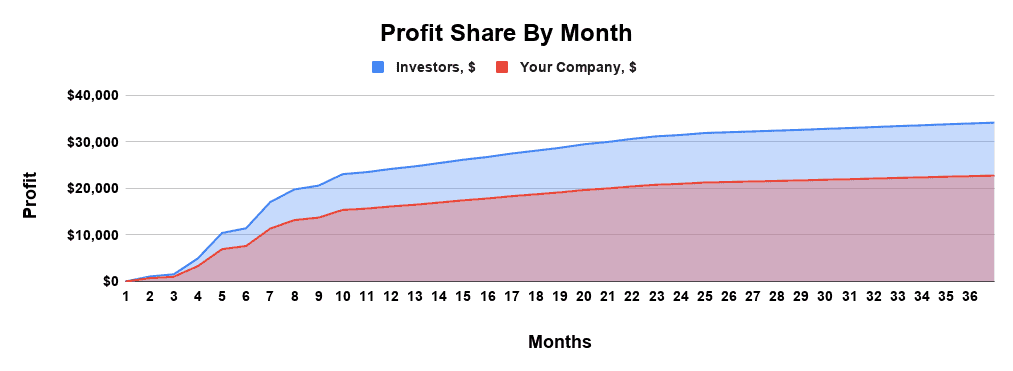
Use this to showcase when investors can expect payments, the overall health of the business, among others.
4. Total capital returned
The model is calculated on a 3-year horizon. After that, the websites are sold. With this, the total capital returned is calculated. This is a summation of the original capital invested plus the proceeds of the asset sale.
This can showcase what happens when the websites are sold and various metrics can be calculated, such as the internal rate of return, annual returns, among others.
5. Year-over-Year (YoY) dividends
To make the numbers simpler to understand, the YoY dividends are calculated in raw dollars to showcase to investors how much they will be paid out yearly.
This allows you to calculate annual return percentages, which can then be compared to other asset classes.
6. Year-over-Year (YoY) cash of cash (CoC) returns
Cash on cash return is a common term used by investors. In short, it’s the income earned on the cash invested into the assets.
The YoY annual cash on cash returns is also calculated. If you are dealing with investors (or yourself) from a real estate background, CoC is a common financial term that is used. This can be used to compare apples-to-apples numbers from two asset classes.
👉 What Are The Different Scenarios That Can Be Modelled?
Using the baseline model provided, you can build upon it with new scenarios. Here are a few scenarios that I find interesting:
1. Impact on ROI with Google Manual Penalties
The worst-case situation is receiving a major manual penalty (or algorithmic) that immediately decreases traffic and thus revenue to a site overnight.
With the setup of the model, you can manipulate it to model the impact. Here is how to do that:
2. Impact of ROI with Website Downtrends
Not all website acquisitions will be a success. Some go to zero instantaneously in the worst-case, and some downtrend over time. The constant downtrend can be due to competitors outpacing you, or an algorithmic penalty.
To model that, do the following:
3. Optimal Investor Equity
It’s not necessary that investors get equity equal to the amount of money they put into the assets. For example, in EF Capital, investors put down 90% of the capital, but receive 60% of the profit share. You can use the model to run different scenarios.
4. Milestone-based Equity
You can do milestone-based equity earnouts, where you receive more equity as certain milestones in growth are hit. Simultaneously, investor equity can be decreased as a function of growth.
These are different scenarios that can be embedded into the model for your specific use case.
👉 Wrap Up: Share Your Model!
The purpose of open sourcing a content site portfolio model is to improve upon it over time. If you add additional features, please share them with me! I would love to integrate the features so this becomes the go-to model.

