This is the October 2020 update for the dating/relationship site. For the previous update (September 2020), check out this post, or check out all the posts here.
I cover the following in this update:
- Traffic and revenue update
- Data analysis of low conversion rates
- Improvements in October
- Planned Improvements for November
Before we get into the case study, check out these three Black Friday deals that are unique this year.
📊 October 2020 Traffic and Income Stats
📉 Pageviews
- May 2020 Pageviews: 40,316
- June 2020 Pageviews: 33,103
- July 2020 Pageviews: 33,367
- August 2020 Pageviews: 31,084
- September 2020 Pageviews: 27,032
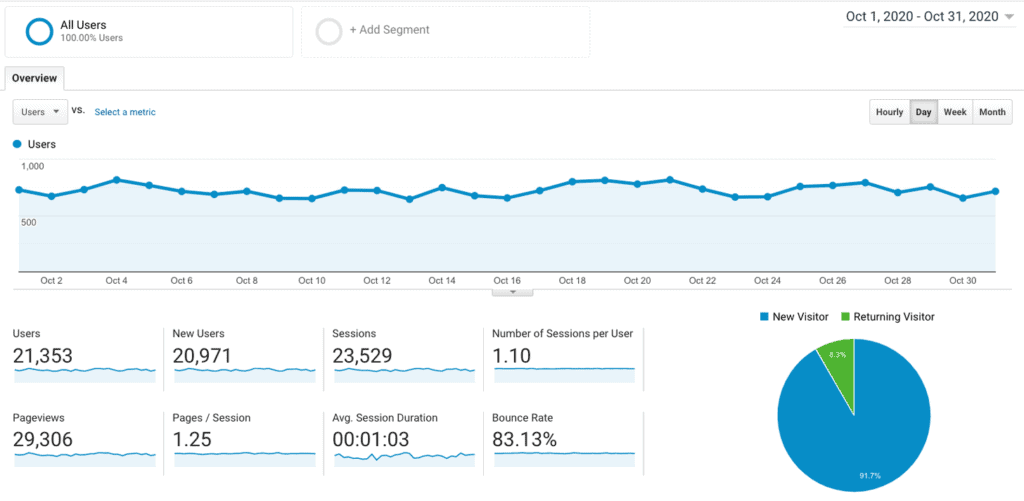
- October 2020 Pageviews: 29,306
October 2020:
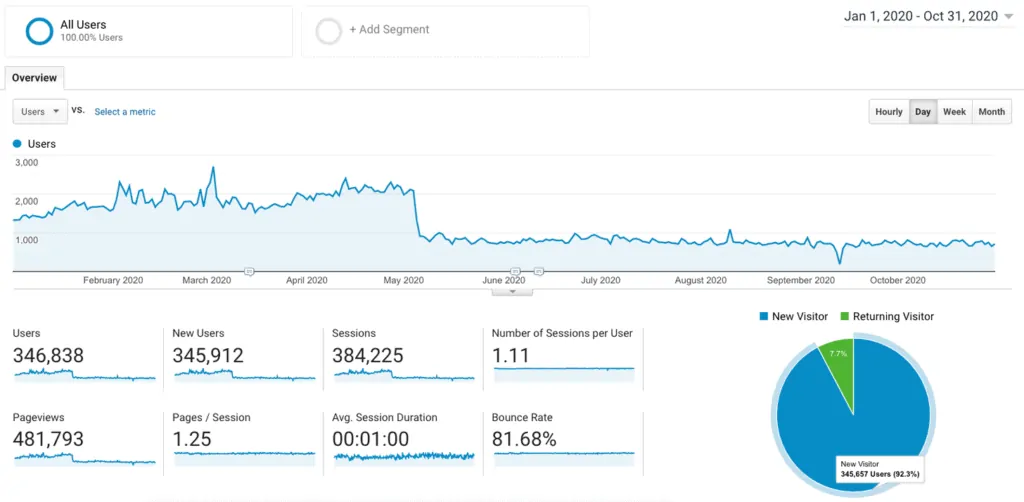
Year to date traffic:
💰 Revenue
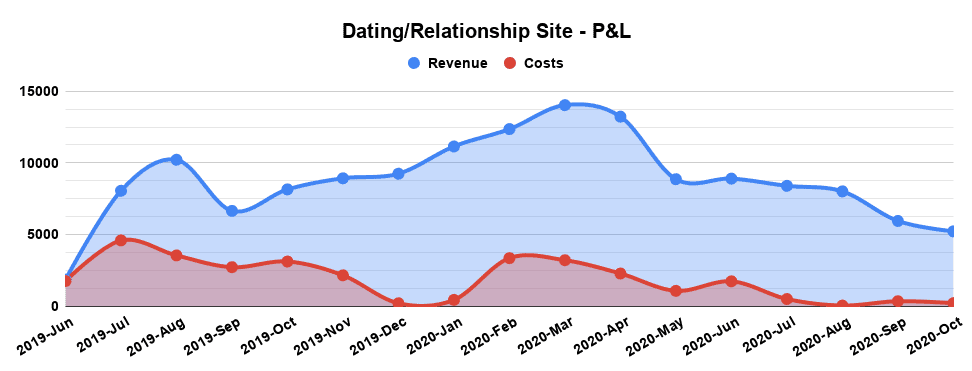
The income dipped but the traffic has been steady. This is due to lower conversion rates on one of our affiliate programs.
This could be due to the impact of COVID on the dating industry, an issue with the program, a change in affiliate landing pages, or a plethora of factors that are out of our control. I unpack the details in the next section.
Last 12-mo P&L
📉 Conversion rates were low (again)…
The drop in income this month was due to two factors. First, my highest paying affiliate offer at $160 per sale was not converting. Second, my high-revenue offer (one that generates usually $4,000+ month) was also not converting.
High-Paying Offer
In September, the high-paying offer at $160 had a conversion rate of 4.9% with 6 sales. In October, it was 0.7% with just 1 sale.
I reached out to my Affiliate Manager but nothing came of it. They stated everything is fine on their end.
Data Analysis of High-Revenue Offer
The offer that was getting the most revenue started to dip the last few months. I wanted to dig into the data to get to the root cause.
I gathered the following data points:
- Cost per action (CPA): payout per sale from the program
- Traffic by month to all relevant pages
- Revenue by month
- History of major changes to the site
I plotted the results to try and see what could be the cause. My open questions were:
- Was revenue decreasing because of a traffic decrease?
- Did the change of CPA cause lower revenues?
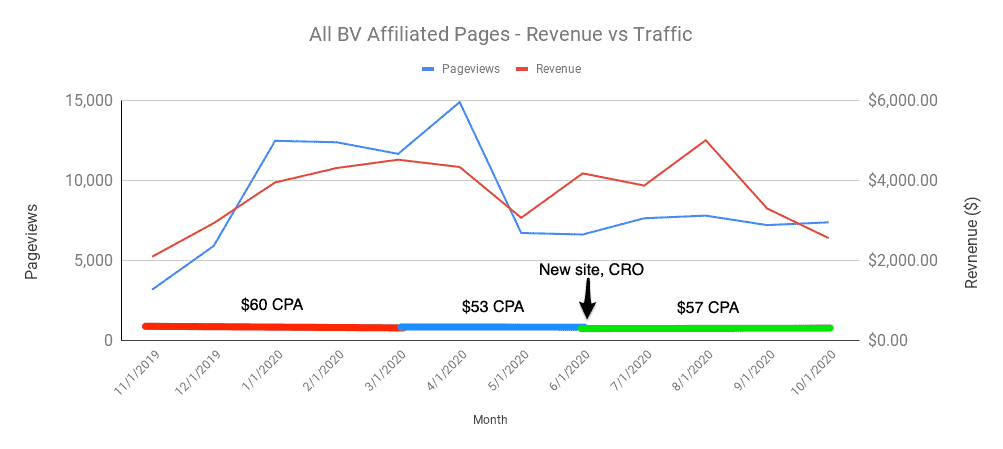
The chart below shows the results summarized:
Takeaways:
- The blue line shows my traffic. The traffic post-Google update has been steady. With that, the red line shows my revenue still decreasing in September and October.
- Even with the program’s changes in CPA, my revenue actually increased most months. This is thanks to all of the CRO techniques implemented.
So what could be the issue? Was it due to seasonality? That was ruled out by Google Trends and industry reports in this space. Check out the trend line below:
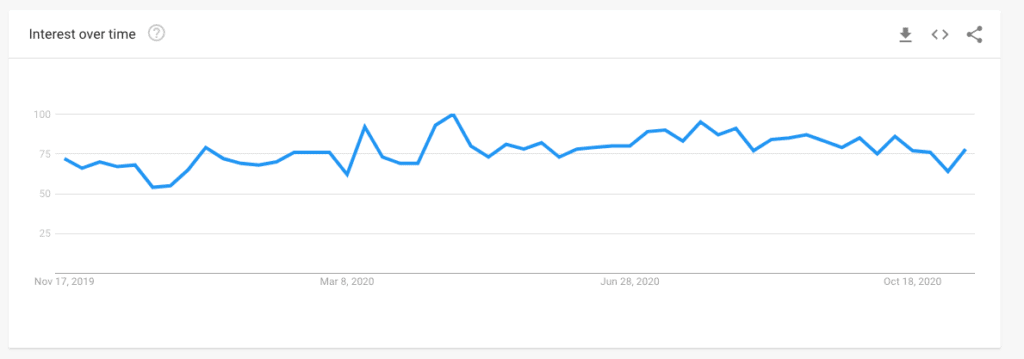
There is nothing here to drastically justify the decrease in conversions and ultimately revenue.
The only course of action was to confront my affiliate program manager.
Confronting the Affiliate Program Manager
I emailed the manager with the above charts. Here’s the back and forth conversation:
Hi,
We went through the data for the last few months and the sales have been down, but the traffic has been the same. See attached figure.
Are you having any technical issues or are the conversion rates down?
The response I received:
Hi Mushfiq,
Let me take a look! We’re actually moving over to a new tracking link this week that could increase conversion rates, would you like to get tested with that right now?
At this point, I was just plain confused. At no point in my 12-years in this industry did I hear that a new tracking link could increase conversion rates. An improper tracking link, however, can decrease conversions since it’s not tracking sales.
I went back and forth via email trying to get to the bottom of it. They kept saying everything is fine and to use the new tracking link.
Final Takeaways
Unfortunately, there is nothing I can do here as an affiliate. Affiliates are at the whims of the brand.
I guess that they were having issues with their old tracking links and did not notify me to change out to the new tracking links.
The key takeaway here is to monitor your conversion rates, revenue, and traffic on an ongoing basis and be on top of it.
I let my guard down for 2 months and lost out on good revenue.
As of November 25, 2020, revenue is back up to normal levels. The affiliate manager has been silent so far. An unfortunate series of events!📅 October 2020: Improvements To The Site
💸 95 pages were Conversion Rate Optimized (CROed)!
At the beginning of October, I went through Google Analytics -> Behavior -> All Pages to find articles that receive traffic last 30 days and need to be optimized.
I usually target pages that get more than 50 pageviews, but to get a boost in revenue, I targeted any page over 10 views.
The optimization for these pages included:
- Adding a comparison table with affiliate products
- Adding call-to-action buttons to affiliate products
- Adding a few affiliate links throughout the page
This niche has high-payouts so any amount of traffic is valuable to monetize. My estimates show that the improvements to these pages should result in an additional $300-$500/mo.
Similar to the optimizations done on the 95 pages in October, I cover 100+ more strategies to increase earnings in my EasyWins.io database. Check that out here.
👉 What can we improve in November 2020?
The traffic has stabilized around 30,000 page views per month. What we can do now is continue improving pages that are not monetized properly, and explore new revenue sources.
Here’s the plan:
- ☑️ Implement Video Ads: the plan is to add video advertisements using Ex.co. These video ads are non-intrusive and do not impact page load speed by much.
- ✏️ Interlinking: I was not able to get to this task in October. Interlinking articles together will help the on-page SEO of the website.
- Find unmonetized pages and perform CRO
Wrap Up
That’s it for the October 2020 update. How did you like this update?


