There are a few large events in the year where an abnormal amount of sales can take place in a short amount of time. This includes Amazon Prime Day, Black Friday, Cyber Monday, and the lead-up to December holidays.
Using my Outdoor site assets (check out prior case studies here), I did an experiment to drive traffic to Amazon’s Prime Day offers. The primary sources of traffic were Site Popups, RSS, Email, Social Profiles, and Facebook Ads. The ultimate goal was to drive sales but also to gauge how engaged my audience was.
In this case study, I will cover:
- Prime Day Setup (landing pages, email list, social posts, ads)
- Case Study Results: Traffic Stats, Revenue, Costs, and Profit
- Final Takeaways/Suggestions
- What I would do differently?
Let’s get to it!
Prime Day Strategy: Deal Page, Emails, and More
💰 Amazon Deals Landing Page
I created two landing pages; identical in nature but with two different Amazon tracking IDs specifically to track sales for Amazon Prime Day. I de-indexed them because they would not rank quick enough for search traffic.
The two landing pages had the following purposes:
- First landing page was for Site, RSS/Direct, and Email Traffic with a unique Amazon ID
- Second landing page was for Social profiles and Facebook ad traffic with unique Amazon ID
The landing page had the following elements in this order:
- Small Intro
- CTA to go to Amazon
- Top Deals list with links to Amazon product pages
- What is Amazon Prime Day?
- When is Amazon Prime Day?
- How Do You Buy During Amazon Prime Day?
- Best Ways to Be Ready for Deals
The last few sections are informative to help those first-timers. All Amazon links were added using the AAWP plugin.
How did I find the actual deals?
To curate a list of top deals, I did the following:
- Search Google for landing pages in your niche that others made in 2019 (or if lucky 2020). Use a search term like [NICHE] “amazon prime day”, or variations thereof. Take the list of products they curated.
- Augment the above list with Best Seller products from my Amazon Associates report for the last 60-90 days
Other blogs have already done the heavy lifting and the brands that participated in 2019 were very likely to participate in 2020.
Each Amazon link had the specific tracking ID for the specific landing page so I could see the sales come in real-time.
✉️ Email Newsletter Copy
The email strategy was:
- Day before: send a reminder that Prime Day is coming up with a link to the landing page
- Prime Day 1: send a reminder that today is Prime Day with a link to the landing page
- Prime Day 2: send a reminder that today is the end of Prime Day with a final link to the landing page
The basic email copy looked like this:
I am not an email copy expert. The goal is to notify subscribers. A variation of this was sent out the three specific days in the morning hours USA time.
📱 Social Posts
As I have covered in past case studies, I have several social profiles for this website. I specifically focused on Facebook as that’s where my most engaged audience resides.
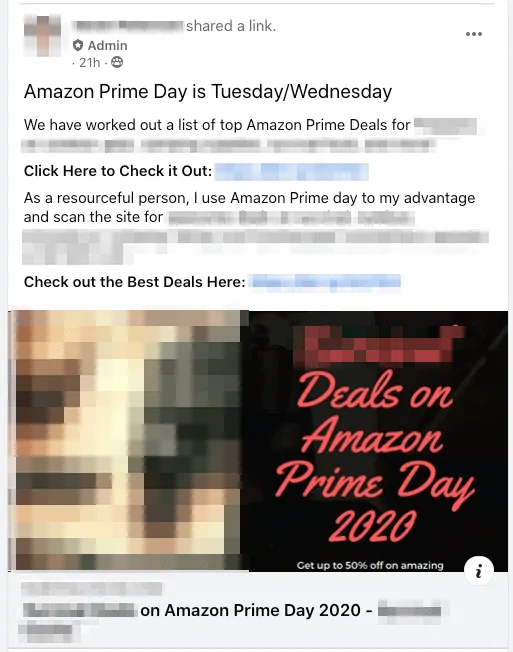
The post I put together looked like this:
The posting process was as follows:
- Posted to my Facebook page and group feeds 3-5 times a day (morning, afternoon, and nighttime) during the two Prime days
- Pinned as Announcements so all users see it when they enter the groups at any point in time
My VA scheduled the posts via Hootsuite. Easy enough!
Facebook Ads
I also ran Facebook ads directed to my Facebook page audience. My Facebook page has 180,000 followers and a subset of active followers can be targeted through the Facebook Pixel. Here is an excellent guide on how to create Facebook audiences.
I did not further segment down the members by age or any demographics; the goal is to get maximum exposure. The active audience that Facebook Ad Manager showed for my page was 69,000.
The ad had these basic settings:
- 1 Campaign, 1 ad group, 1 ad: no split testing with many ads as it’s a 2-day event
- $40 daily budget, running all the time
- US only, ages 18-65+, All genders
- Manual placement on only Facebook News Feed
- Optimization goal is Link Clicks
- Simple image-based ad
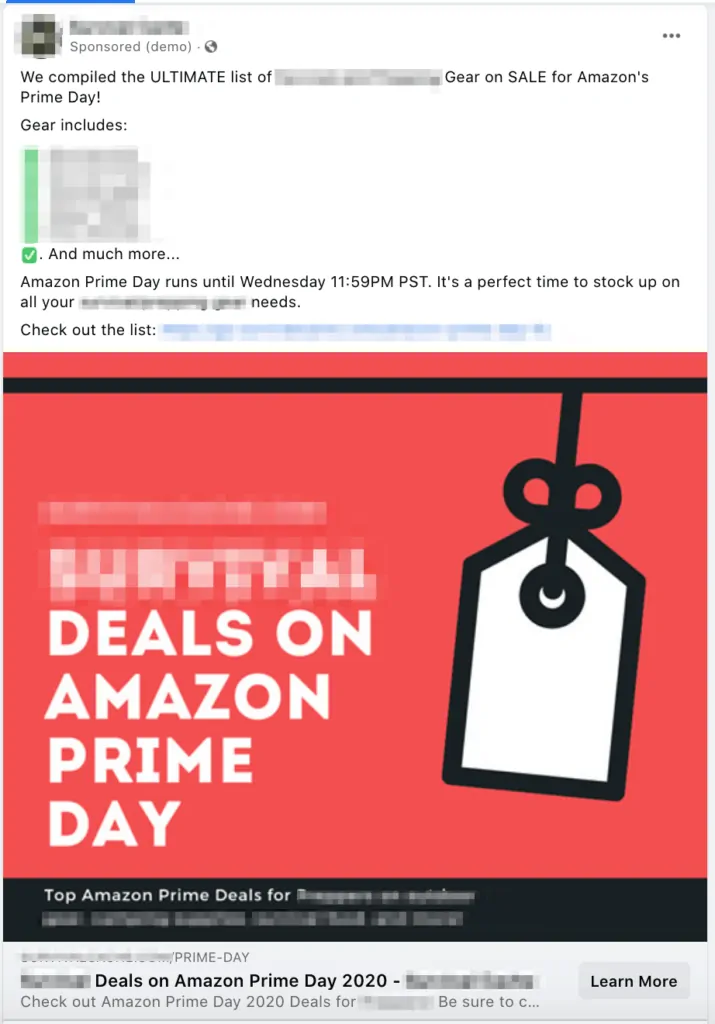
Here is what the ad looked like:
The red color background really grabs the user’s attention. The ad links directly to my landing page.
The ads ran from Monday 10:00 PM to Wednesday at 11:59 PM.
Popups
This site uses OptinMonster for email opt-in capture and to show offers.
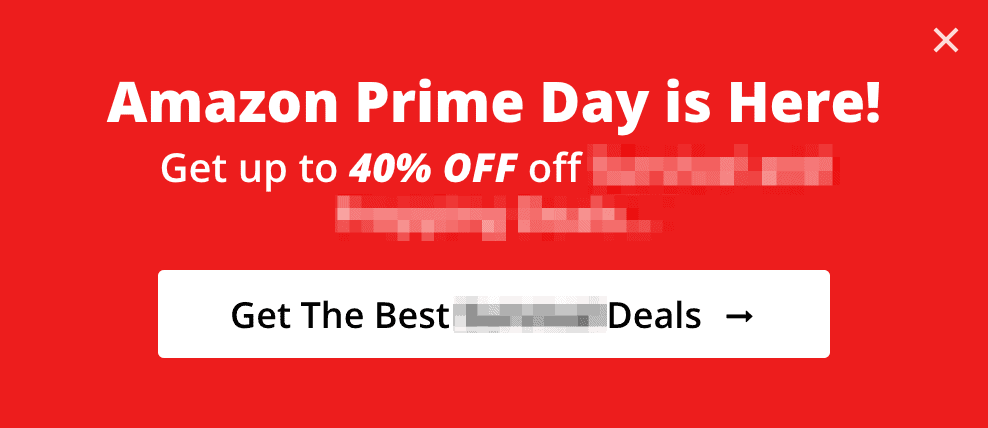
I disabled all existing opt-in forms and quickly created a basic offer popup. This is what it looked like:
It was one of the premade attention-grabbing popups provided by OptinMonster. All I did was add in the text and the link to the landing page.
This was shown aggressively to all normal website visitors after 15-seconds (note: most of my popups show after 50-seconds so this was aggressive).
The goal was to drive everyone to the landing pages.
Keeping Track…❓
How do I keep track of the traffic to understand what was most profitable?
As I eluded at the top, I created two Amazon tracking IDs to track sales from each channel: email/RSS and social
I use a link tracking service called ClickMagick for this site. This allows me to do the following:
You get the idea. I create two shortened links; one for the social landing page, and another for email/RSS. I can then add up to 5 nested SUBIDS (e.g. /emailblast1, /link1) to keep track of the traffic.
This will allow me to see which Email blast to which Facebook group sent the most traffic.
I can then do “back of the envelope” math from the sales from the Amazon tracking IDs to understand which source generated the most sales.
Let’s now talk results!
🔥 Case Study: Was it worth the effort?
These sale events take place a few times a year. So the question remains: was it worth the extra effort?
To answer that, I need to list out how many hours both my VA and I spent on this.
⏱️ How Much Time Did This Take?
I’ve been using a software called TrackingTime to keep track of each task I do for my day job, websites, and this newsletter. This is a broader approach I am taking to keep my hours tracked so I can see what provides the highest ROI in my life and businesses.
VA Tasks
- Create 2 Landing pages with affiliate links: 2 hour
- Social Image creation (2 images): 0.5 hours
- Social posts scheduled (6 posts using Hootsuite): 1 hour
My Tasks:
- Finalizing landing pages: 0.5 hour
- Adding product links to landing pages: 0.5 hour
- Writing three email copies and schedule: 2 hours
- Popups: 1 hour
- Pinned Announcements in Facebook: 0.25 hour
- Facebook Ad creation: 1 hour
- Final results calculation: 1 hour
Total Time for VA: 3.5 hours
Total Time for Mushfiq: 6.25 hours
💸 Facebook Ads Results
The benefit of having a large Facebook page is the ability to retarget those followers using Facebook Ads.
Here are the results from the ads:
Here are engagement metrics on the ad itself over the two days:
Here is the breakdown by day:
- Prime Day Day Before (2-hours): 17 clicks, $0.09 CPC, 10.49% CTR
- Prime Day 1 (24-hours): 435 clicks, $0.06 CPC, 8.33% CTR
- Prime Day 2 (24-hours): 455 clicks, $0.08 CPC, 5.98% CTR
The total cost was $67.25 over the course of the few days.
That in my opinion is excellent traffic at a relatively low cost. However, the return on investment is what counts here (covered in subsequent sections).
There are many case studies online (like this one by Human Proof Designs) that show Facebook Ads not providing enough of an ROI.
The purpose of my experiment was to see if it provides enough ROI during high-sales events; not the normal time periods.
📥 Email Results
I have been putting a TON of focus on my email list for this business. I need to understand open rates, clickthrough rates, and unsubscribe rates. Here is a screenshot of the stats from Sendy, a self-hosted email software:
Here is the breakdown:
- Day Before: 3,026 opened, 740 clicked
- Day 1: 3,375 opened, 735 clicked
- Day 2: 3,308 opened, 581 clicked
To summarize, the emails had an average open rate of 19% (typically receive 20%). The average click-through rate was excellent at 4% (usually receive 2.5%). This equated to 2,056 clicks to the site!
Another important metric is how many people unsubscribed from the list. Here is the progression of unsubscribers from the first to last email:
- Day Before: 20 — (0.12% unsubscribe rate)
- Day 1: 37 — (0.22% unsubscribe rate)
- Day 2: 34 — (0.20% unsubscribe rate)
Overall, my average unsubscribe rate over the last 4 months has been 0.15% so this is not that far off. I do send 3 emails a week with 2 of them being promotional offers. The main reason my unsubscribe rate was higher on Prime Day was that I sent the same email topic the past 3 days; people were probably just not interested anymore.
Ultimately, the goal with an email list is to provide value and in return make money. I am OK with unsubscribers as long as the email blast itself made a profit!
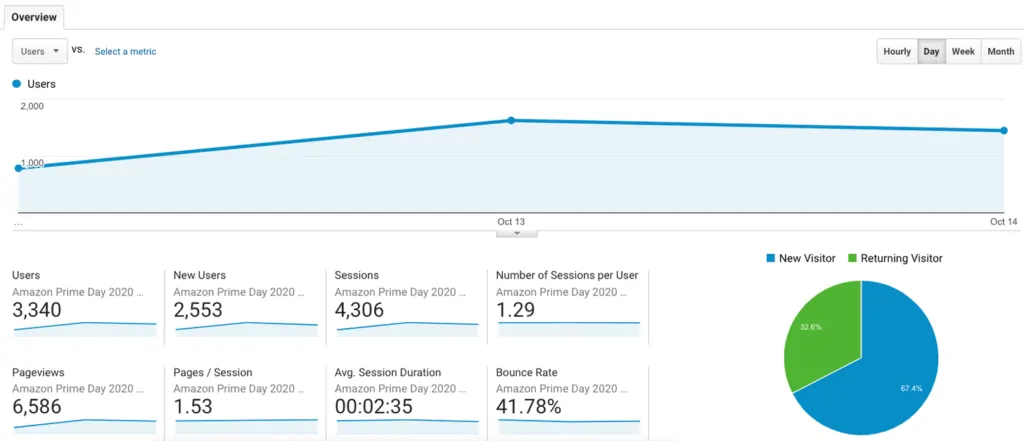
📈 Total Traffic to Landing Pages —> 6,586 Pageviews!
Here are screenshots of the total traffic to the two landing pages by source:
This experiment drove 4,306 sessions and 6,586 pageviews! Since I had a large list of products on the landing pages, users stayed around to review the products with more than 2 minutes on-page.
But the real question is what is the breakdown of traffic by source? Using Google Analytics and the link tracking tool that I use (ClickMagick), I can generate a traffic report for unique sessions.
Here are the numbers:
- RSS/Direct Traffic: 1,804
- Site Visitors (Popup): 258
- Email Blast 1 (10/12): 731
- Email Blast 2 (10/13): 928
- Email Blast 3 (10/14): 468
- Facebook Page: 193
- Facebook Group #1 (55,000 users, OGL): 113
- Facebook Group #2 (350 users, SC): 19
- Facebook Group #3 (3,000 users, STF): 26
- Facebook Ads: 907
There you have it! The raw numbers. Let’s analyze!
1️⃣ Popups were a disappointment!
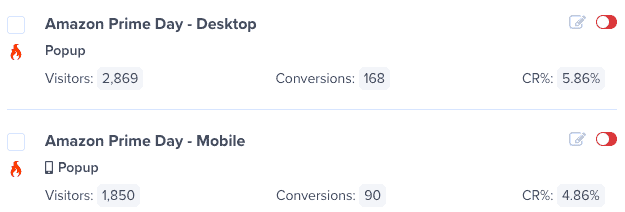
I expected the popups to do better honestly. Here is the performance report from OptinMonster:
My typical conversion rate for email capture is 1.2%. From the screenshot, the new popup that redirected users to the Amazon landing page did 4.86% on Mobile and 5.86% on Desktop.
You could say that’s a good conversion rate but I expected much more at around 10%.
The popup design (see above sections) was “in your face” red color. This could have been a turn off since my site’s color theme is black and brown. Or, random people who came to my site just did not have an interest in shopping on Amazon Prime Day.
2️⃣ Facebook Page and Group traffic were very low!
I expected much more traffic from my social profiles.
Facebook Page recap
The Facebook page has a 180,000 following and drives nice traffic to the site every month organically via posted content. With that, I expected more than the 193 visitors that I received to the landing pages.
This could be how I worded my Facebook post to the image being used. Or it also could be that the people already knew about Amazon Prime Day.
Facebook groups
My Facebook groups are very active and self-run by the users. The Amazon Prime Day posts went out 3-5 times daily, and a post was pinned at the top as an Announcement in the groups.
The total traffic was 158 visitors! Way too low!
3️⃣ RSS/Direct Traffic was surprising!
The site does have a lot of RSS subscribers from back in the day (circa 2010).
I was surprised that almost 1,800 people came to the site from direct traffic. The site is trusted in the industry and this shows.
Now let’s review the numbers!
💰 Total Revenue Per Landing Page
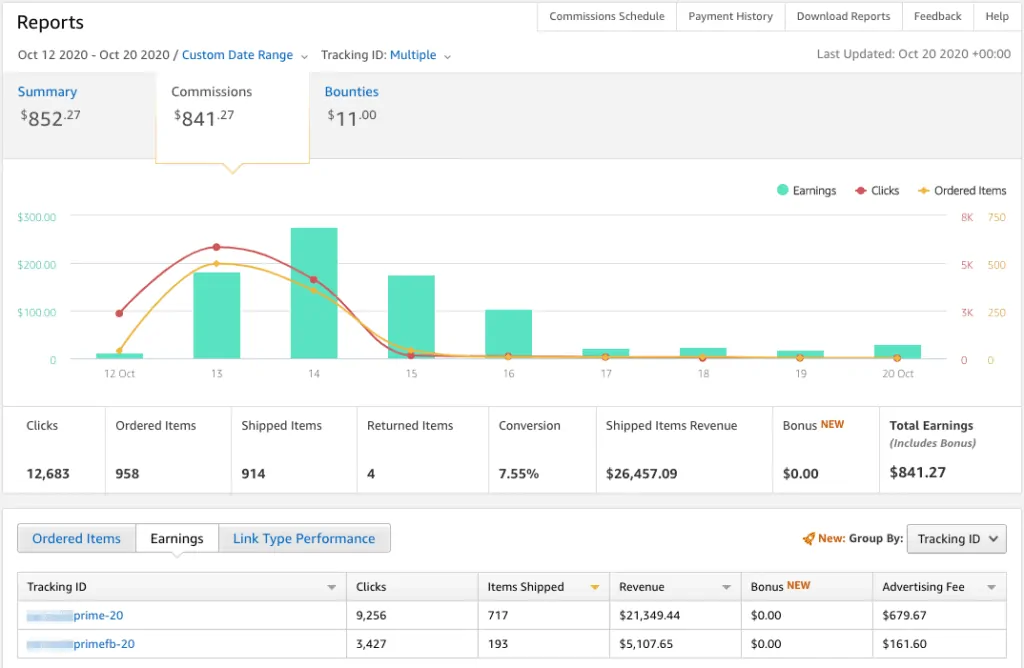
The total revenue generated was:
- Tracking ID 1 (Site/RSS/Email): $679.67
- Tracking ID 2 (Social Profiles/Ads): $161.60
To keep things simple, we will multiply the specific total by the ratio of traffic sources to get an estimate of revenue by traffic source.
Here are the revenue results calculated out by source:
- RSS/Direct Traffic: $292.70
- Site Visitors (Popup): $41.86
- Email Blast 1 (10/12): $118.61
- Email Blast 2 (10/13): $150.57
- Email Blast 3 (10/14): $75.93
- Facebook Page: $24.79
- Facebook Group #1 (55,000 users, OGL): $14.52
- Facebook Group #2 (350 users, SC): $2.44
- Facebook Group #3 (3,000 users, STF): $3.34
- Facebook Ads: $116.51
1️⃣ Facebook Ads were a flop
I pushed all social traffic to one specific landing page. The revenue was $116.51, but my Facebook ad costs were $67.25.
While a positive ROI, it’s not enough to justify the extra effort.
Facebook = 👎
2️⃣ Facebook Groups/Page was a flop
The total from Facebook (disregarding ads) was $45.09.
This tool my VA 1.5 hours to get set up, and 0.5 hours of my time. Again, not worth the effort.
Facebook = 👎
3️⃣ Popups were a flop
I will not be utilizing any sitewide popups going forward. It did not generate enough revenue ($41.86), but it does degrade the user experience throughout the site.
4️⃣ RSS/Direct traffic won the day
Since the acquisition, I’ve been wondering how to monetize this extensive direct/RSS traffic source that I have.
Solution found! Giving them exclusive access to deals pages can generate significant revenue with NO effort really. The total revenue was $292.70
RSS traffic = 👍
5️⃣ Email traffic
Emails generated the most revenue at $345.11. In comparison to RSS/Direct traffic, this did take more effort; approximately 2 hours of my time.
But it was definitely worth it!
Email traffic = 👍
👉 Results: Profit and “Equity” Value
My VA charged me a total of $30 for the work he did. To recap, here are the final numbers.
- Total Revenue ($): $841.27
- Total VA Costs ($): $30
- Total Facebook Ad Costs ($): $67.25
- My Time: 7 hours
When I go to sell the site, since this is a one-time event, the profit would need to be averaged out over 12-months. Also, I would need to document the process so the next owner can do exactly what I did to get the same or better results.
This equates to an average of $64.50. At a 30x multiple, that’s $1,935 of equity value.
Altogether, the total potential value generated here was $2,679
💡 Final Takeaways
Here are my overall takeaways
✔️ This is not going to work for everybody…
I did not do this type of promotion for all of my sites? Why? The effort is not worth it.
This site has many sources of traffic that can be pushed on-demand (e.g., Email, social), and also receives 100,000 visitors every month overall.
For website portfolio owners like myself, the effort is warranted on sites with a lot of traffic and on-demand sources.
Your mileage will vary!
✔️ On-demand traffic is key to longevity
This case study experiment is proof that even if my organic traffic dies tomorrow, I still have assets in the business (email list, RSS, social) that can drive traffic to my website and generate revenue from affiliates and ads.
Diversification in traffic and revenue is key to business longevity!
✔️ Focus on traffic that converts
Each business has specific traffic that will convert better. For this business, direct, RSS, and email traffic converted the best.
Social traffic including Facebook Ads was a downer.
Each business has it’s top traffic sources.
Test your traffic and focus on what moves the needle!
What Would I Do Differently? 🤔
It’s always good to recap and learn from mistakes. This is what I would do potentially differently:
- Setup more granular tracking: I have all the tools in place to do this. I wanted to cut down on any extra effort and time for this experiment since it was the first one. Though, better tracking would give me more accurate results instead of rough estimates.
- Keep up-to-date on Prime deals: Prime deals come and go by the hour on Amazon. I did not update my landing pages throughout the event days with new deals. However, I am sure if I did, it would yield more sales. Is it worth it to sift through deals? Personally, no. But for you, maybe.
- Push Pinterest: I did not do any promotions or posts on Pinterest. I have no idea if this channel works (albeit my following is also low).
- Publish Article: I did not publish an indexed article. If I would have planned earlier, I could have published the landing page a month (or two) in advance, which would have given it enough time to rank in Google (due to site authority) and drive organic traffic.
Wrap Up
That’s a wrap. Looking at my results and setup, is this something you would try?

